Graphs, charts, tables, infographics, and timelines are graphics that represent numerical information such as statistics, percentages, and dates. This strategy is part of Colorin Colorado's ELL Strategy Library and can be used to support academic language development for all students.
Strategy Overview
How This Strategy Supports Language Development
Graphs, charts, and tables
Numerical data such as percentages and statistics can be abstract and difficult for students to understand. Graphs, charts, and tables make that numerical information easier to visualize and much more comprehensible. Learning how to read (and create) these kinds of graphics takes practice, but it is a critical skill that students will use across content areas and in daily life.
Timelines
Understanding dates and the sequences of events, especially those that happened a long time ago, also takes practice. Timelines give students a concrete visual that allows them to see when events happened and the order in which they happened.
Infographics
Infographics combine illustrations, text, and graphics like charts and graphs to share information or concepts. Learning how to interpret infographics and understand how all of the elements fit together takes practice, especially since infographics can vary so widely in format.
Step-by-Step Instructions
Learning to read graphs, charts, and timelines
1. When teaching students how to read a graph, chart or timeline, start with just one type of resource at a time and take some time to help students get familiar with it. For example, talk about the names of the different kinds of graphics so that students can remember which is which. (You can see how Mr. Jesus Ortiz does this in the video below.)
- Bar graphs use bars of different sizes.
- Line graphs use lines of different sizes.
- Pictographs use pictures.
- Infographics show information in different formats.
- Pie charts look like a pie.
- "Table" is another word for "chart." Where else do we use the word "table"?
- Timelines show dates on a line.
2. Start with basic examples to help students understand what the numbers and pictures represent. Be sure to include relevant information such as:
- What x and y axis represent
- What percentage means
- Scale on a timeline or graph
- Categories in a chart or table
3. Walk students through the steps you need to read the graph. Give students lots of practice and highlight the academic language related to the lesson. This is a great time to use modeling (I do, we do, you do), peer work, and frequent comprehension checks.
Creating and presenting graphics
- When numbers, statistics, percentages, dates, or other numerical information appear in texts or videos, stop and demonstrate how to turn that information into a graphic representation.
- Guide students with step-by-step instructions on how to turn numerical information into a visual representation so they can more easily comprehend the data. (This will work best for graphics they already know how to use and read.)
- Model how to use the graphic representation to talk about the numerical information. See example below.
- Have students create their own graphics and ask them to use the graphic to explain the concept, answer questions with specific information from the graphic, or summarize the concept.
Lessons Learned
- Stick to one type of graphic at a time until students have mastered it.
- Connect graphic representations to lessons from different content areas so students see how graphs, charts, and tables can apply to reading informational texts as well.
- When teaching students how to create their own charts, tables, timelines, or graphs, first have them identify the categories the numerical information is representing. Then have them fill in the numbers and create a visual of that information.
- Clearly label and define each part of the graphic representation and ask students to do so as well.
- If you are having students create their own graphics, learn more about the digital tools available in addition to walking them through making graphics by hand.
Differentiation
- Represent numerical information using the types of graphics students have already learned in math or science classes.
- Use students' heritage languages to explain each part of the graphic representation.
- Chunk the creation of each graphic scaffold and co-create them with students during reading of texts or listening to videos with numerical information.
- Use visuals with labels for each part of the graph (e.g. x y axis).
- Ask students what type of graphic representation would be most useful in a situation (line graph, infographic, timeline, etc.).
- Use smaller numbers as a model of the process of creating the graph.
Examples
Co-Teaching Considerations
Content or Grade-Level Teacher
- Determine the key numerical information students need to know for the unit.
- Determine the language expectations for the lesson unit. Which dates, statistics, numbers, etc. will students need to use to be successful on the summative assessment and daily lesson?
- Collaborate with the ELD teacher to design appropriate graphic scaffolds to support students' comprehension of the information and support their academic speaking and writing about the numerical information.
English Language Development Teacher
- Consider options for graphic representation of numerical information.
- Co-create the graphic scaffold with students based on the type of numerical information provided.
- Work with small groups of students to model with heritage language support as necessary.
| Topic | Examples |
|---|---|
Introducing percentage | 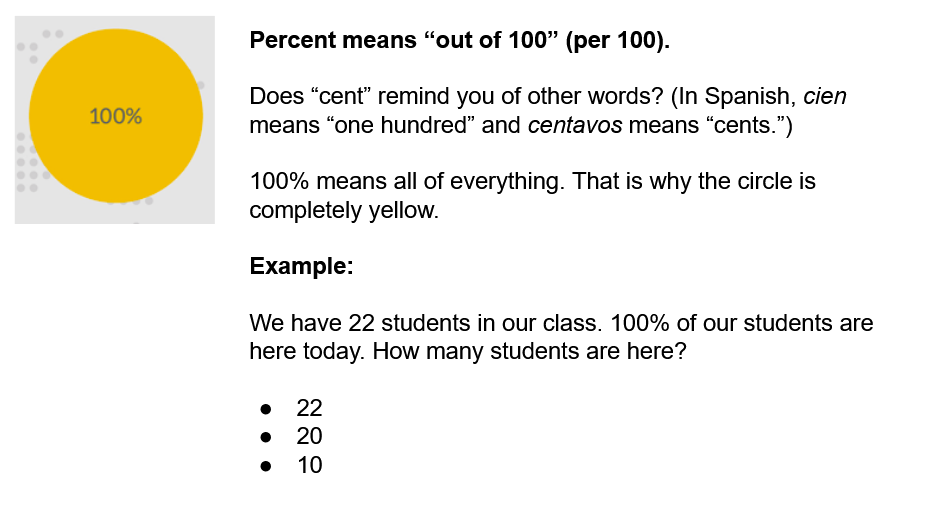 |
| Showing a text example from All Thirteen: The Incredible Rescue of the Thai Boys' Soccer Team by Christina Soontornvat | 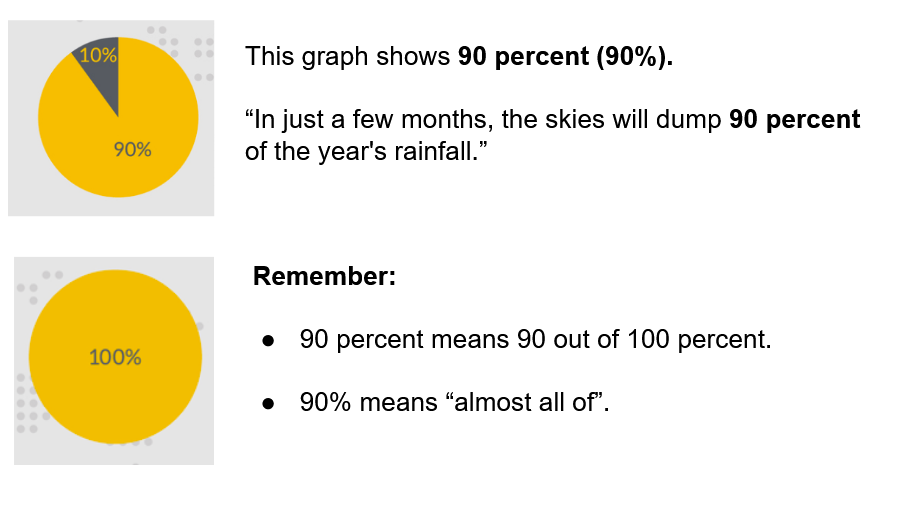 |
| Comprehension check with a different kind of visual (and one familiar to students!) | 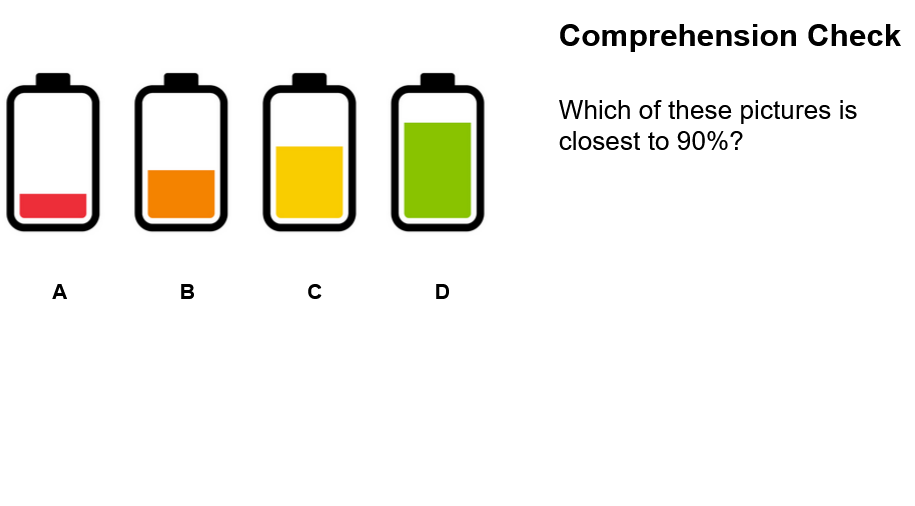 |
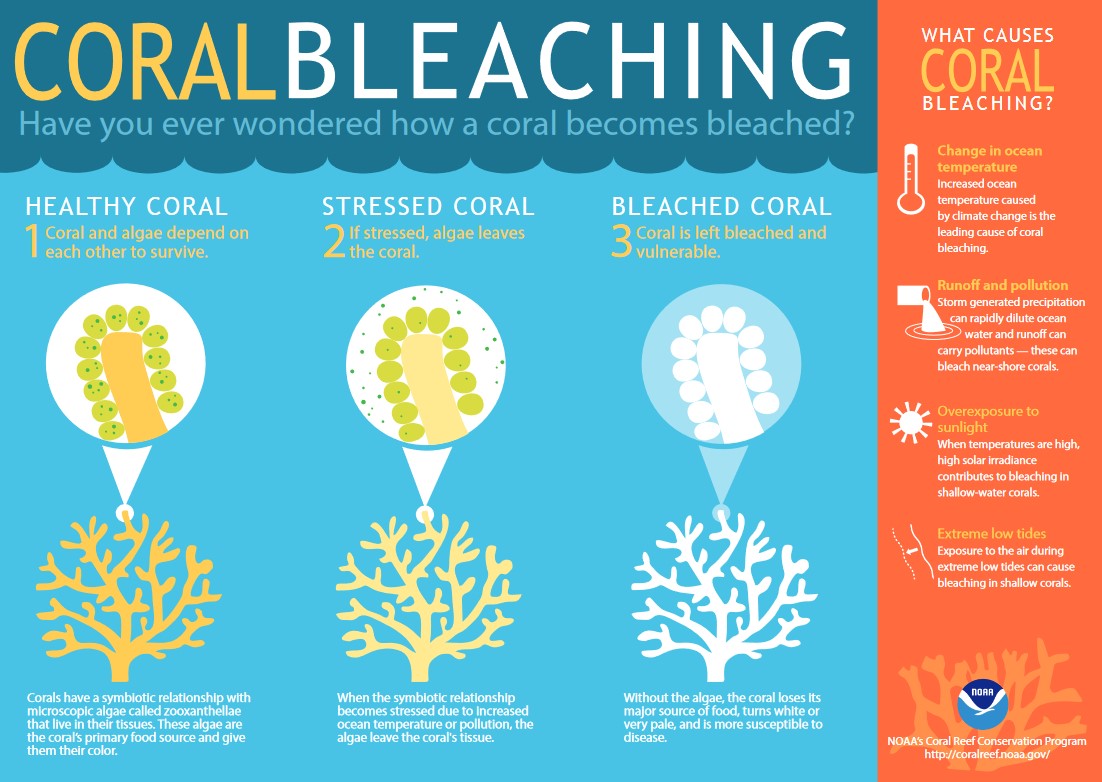
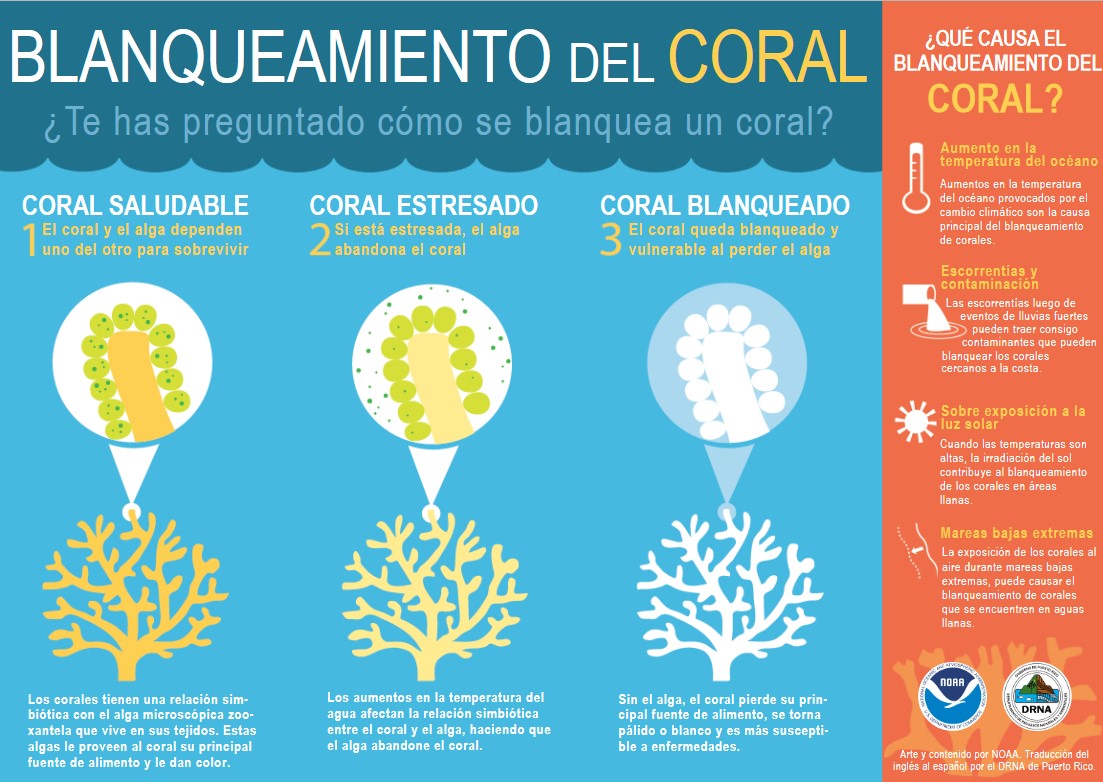
| Infographics on coral bleaching in English and Spanish |
What is coral bleaching? (NOAA.gov) |
| More lesson plans and examples | Graphs
Timelines
Infographics |
Videos: Reading a Pictograph
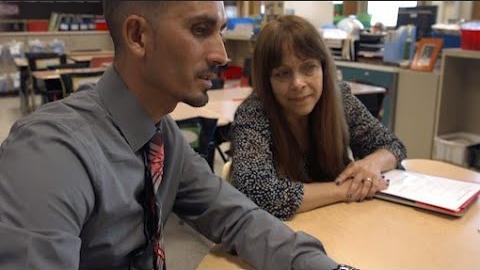
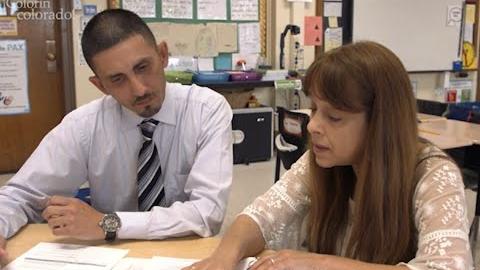
In these videos, Mr. Jesus Ortiz in Syracuse, NY teaches a lesson on reading pictographs and discusses the lesson with his peer evaluator for English as a New Language (ENL), Areli Schermerhorn. The second video focuses on writing language objectives related to his lesson. These videos are part of a project about evaluating teachers of ELLs.
Resources
- How to scaffold graphs (Pivot Interactives)
- Lab report format with graphic scaffolds (Google Doc example)
References
- Three types of scaffolds (Teaching MLs with Tan Huynh)